Contents
TAREA MATLAB
EJERCICIO 1. Curva de Bézier
Apartado a) Cálculo del factorial recursivo
n=3;
factorial=factr(n)
factorial =

     6
Apartado b) Función combina
n=3;
j=2;
combinacion=combina(n,j)
combinacion =

     3
Aparatado c) Polinomio de Bernstein
n=3;
t=0.4;
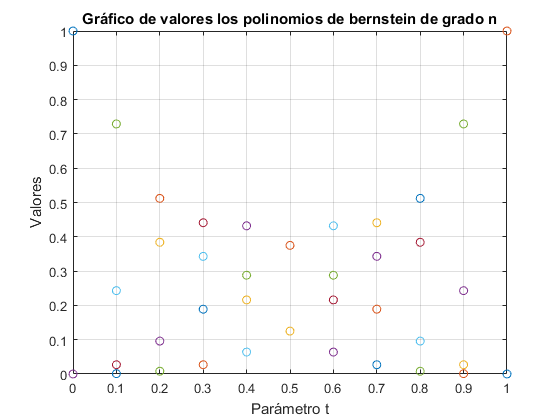
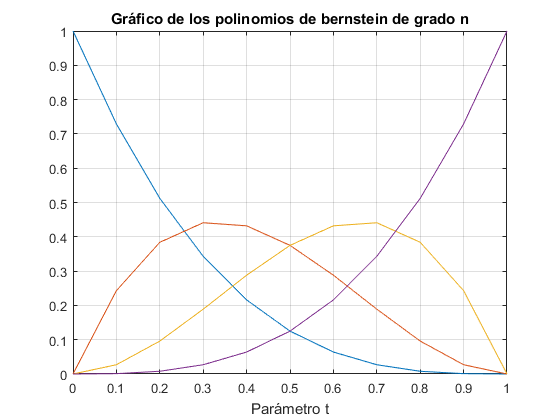
polinomio=bernstein(n,t)
t1=0:0.1:1;
ber_vect(n,t1);
polinomio =

    0.2160
    0.4320
    0.2880
    0.0640
Apartado d) Gráficas del polígono de control y la curva de Bézier
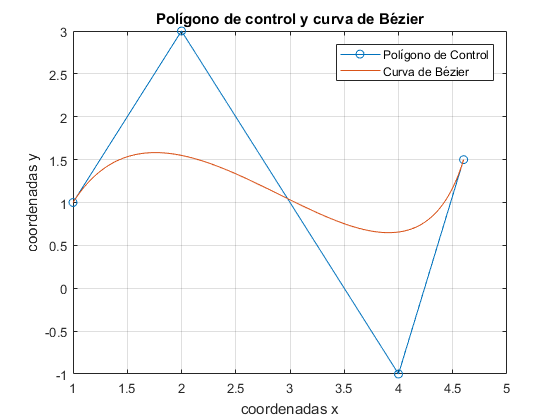
vx=[1 2 4 4.6]';
vy=[1 3 -1 1.5]';
t=0:0.01:1;
figure(3)
plot(vx,vy,'-o');grid on, hold on;
title('Polígono de control y curva de Bézier'); xlabel('coordenadas x');ylabel('coordenadas y');
n=3;
X1=[];Y1=[];
for j=t
b=bernstein(n,j);
x1=vx.*b;
y1=vy.*b;
X1=[X1 x1];
Y1=[Y1 y1];
end
xx=[];yy=[];
for j=1:length(X1)
xx=[xx;sum(X1(:,j))];
yy=[yy;sum(Y1(:,j))];
end
plot(xx,yy);hold off
legend('Polígono de Control','Curva de Bézier');
Ejercicio 2. Velocidad de viento y potencia del aerogenerador
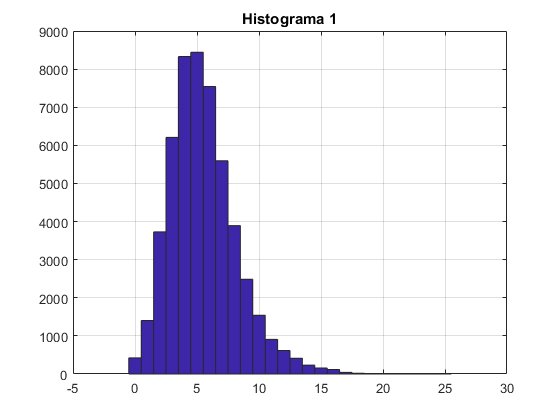
Apartado a) Lectura de datos y gráfico del histograma
lect1=xlsread('sotaventogaliciaanual.xlsx');
int1=0:25;
figure(1)
hist(lect1(:,1),int1);grid on
title('Histograma 1');
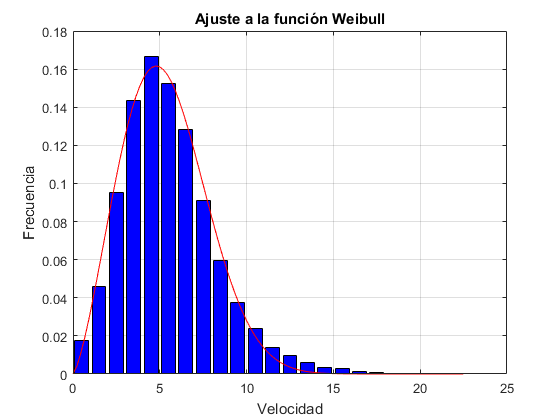
Apartado b) Lectura de datos, gráfico del histograma de frecuencias y ajuste de Weibull
lect1=xlsread('sotaventogaliciaanual.xlsx');
velocidad=lect1(:,1);
if any(isnan(velocidad))
x=1:length(velocidad);
i=find(~isnan(velocidad));
velocidad=interp1(x(i),velocidad(i),x);
end
x=0.5:1:max(velocidad);
horas=hist(velocidad,x);
frec=horas/sum(horas);
modelfunc=@(a,x) (a(1)/a(2))*((x/a(2)).^(a(1)-1)).*exp(-(x/a(2)).^a(1));
beta0=[mean(velocidad) std(velocidad)];
beta=nlinfit(x,frec,modelfunc,beta0);
figure(2)
bar(x,frec,'b');grid on;hold on
x=linspace(0,max(velocidad),100);
y=modelfunc(beta,x);
plot(x,y,'r')
title('Ajuste a la función Weibull')
xlabel('Velocidad')
ylabel('Frecuencia')
hold off
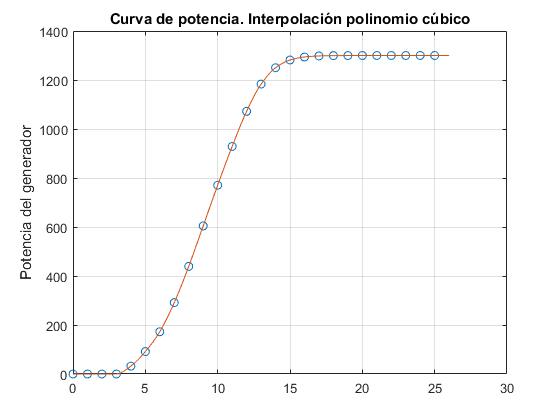
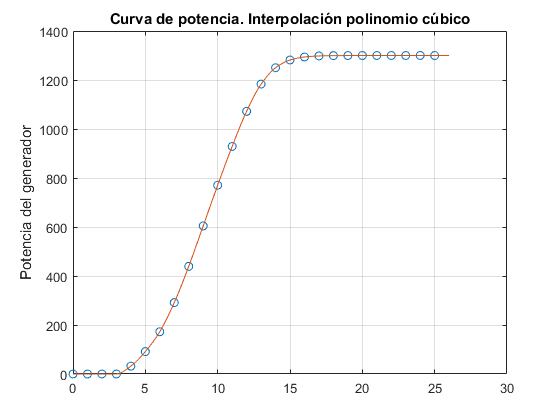
Apartado c) Interpolación de la curva de poencia del aerogenerador
lect2=xlsread('sotavento_curva potencia.xlsx');
x = lect2(:,1);
y = lect2(:,2);
n=length(x);
xx = linspace(0, n);
y1=interp1(x,y,xx,'pchip');
figure(3)
plot(x, y, 'o', xx, y1, '-');grid on;title('Curva de potencia. Interpolación polinomio cúbico')
ylabel('Potencia del generador')
Apartado d) Script que agrupa los dos apartados anteriores e introduce la integración por quad
lect1=xlsread('sotaventogaliciaanual.xlsx');
velocidad=lect1(:,1);
if any(isnan(velocidad))
x=1:length(velocidad);
i=find(~isnan(velocidad));
velocidad=interp1(x(i),velocidad(i),x);
end
x=0.5:1:max(velocidad);
horas=hist(velocidad,x);
frec=horas/sum(horas);
modelfunc=@(a,x) (a(1)/a(2))*((x/a(2)).^(a(1)-1)).*exp(-(x/a(2)).^a(1));
beta0=[mean(velocidad) std(velocidad)];
beta=nlinfit(x,frec,modelfunc,beta0);
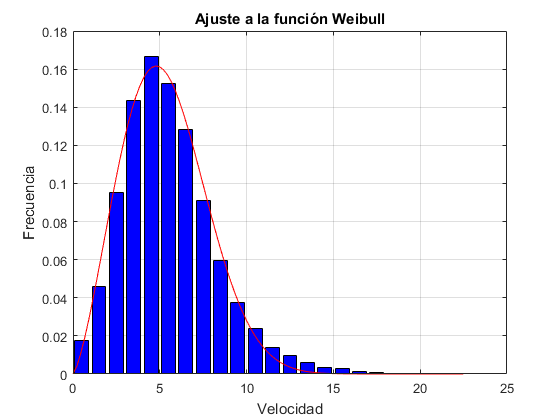
figure(4)
bar(x,frec,'b');grid on;hold on
x=linspace(0,max(velocidad),100);
y=modelfunc(beta,x);
plot(x,y,'r')
title('Ajuste a la función Weibull')
xlabel('Velocidad')
ylabel('Frecuencia')
hold off
lect2=xlsread('sotavento_curva potencia.xlsx');
x = lect2(:,1);
y = lect2(:,2);
n=length(x);
xx = linspace(0, n);
y1=interp1(x,y,xx,'pchip');
figure(5)
plot(x, y, 'o', xx, y1, '-');grid on;title('Curva de potencia. Interpolación polinomio cúbico')
ylabel('Potencia del generador')
k=beta(1);c=beta(2);
potencia=0.5*1.225*sum(velocidad.^3)/length(velocidad);
fprintf('Potencia, directamente de las medidas: %3.1f\n',potencia);
media=mean(velocidad);
media=mean(velocidad);
potencia=0.5*1.225*media^3*gamma(1+3/k)/(gamma(1+1/k)^3);
fprintf('Potencia, función Weibull: %3.1f\n',potencia);
Pr=1300; x0=4.0;xr=20;x1=25;
potencia=xlsread('sotavento_curva potencia.xlsx','B2:B27');
x=0:1:25;
pot=potencia(x>=x0 & x<=xr);
x=x0:1:xr;
p=polyfit(x,pot',3);
yp=polyval(p,x);
f=@(x) (k/c)*((x/c).^(k-1)).*exp(-(x/c).^k);
h=@(x) f(x).*polyval(p,x);
power=quad(h,x0,xr);
fprintf('La potencia media es: %3.1f\n',power)
Potencia, directamente de las medidas: 187.8
Potencia, función Weibull: 170.0
La potencia media es: 199.1
EJERCICIO 3. Movimiento de un sistema masa-resorte-amortiguador
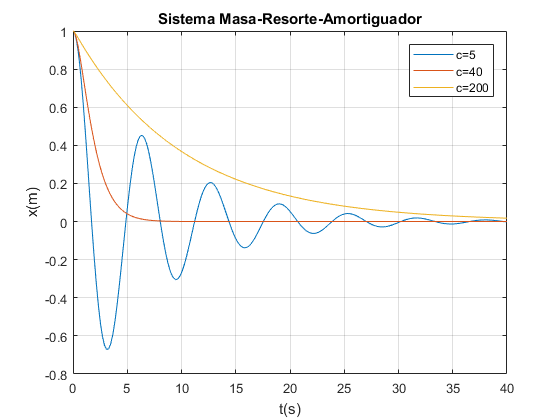
m=20;
k=20;
xv0=[1,0];
tf=40;
c1=5;
c2=40;
c3=200;
f1=@(t,x) [x(2);(-k*x(1)-c1*x(2))/m];
f2=@(t,x) [x(2);(-k*x(1)-c2*x(2))/m];
f3=@(t,x) [x(2);(-k*x(1)-c3*x(2))/m];
[t1,x1]=ode45(f1,[0,tf],xv0);
[t2,x2]=ode45(f2,[0,tf],xv0);
[t3,x3]=ode45(f3,[0,tf],xv0);
plot(t1,x1(:,1),t2,x2(:,1),t3,x3(:,1));grid on
xlabel('t(s)');
ylabel('x(m)');
title('Sistema Masa-Resorte-Amortiguador');
legend('c=5','c=40', 'c=200');
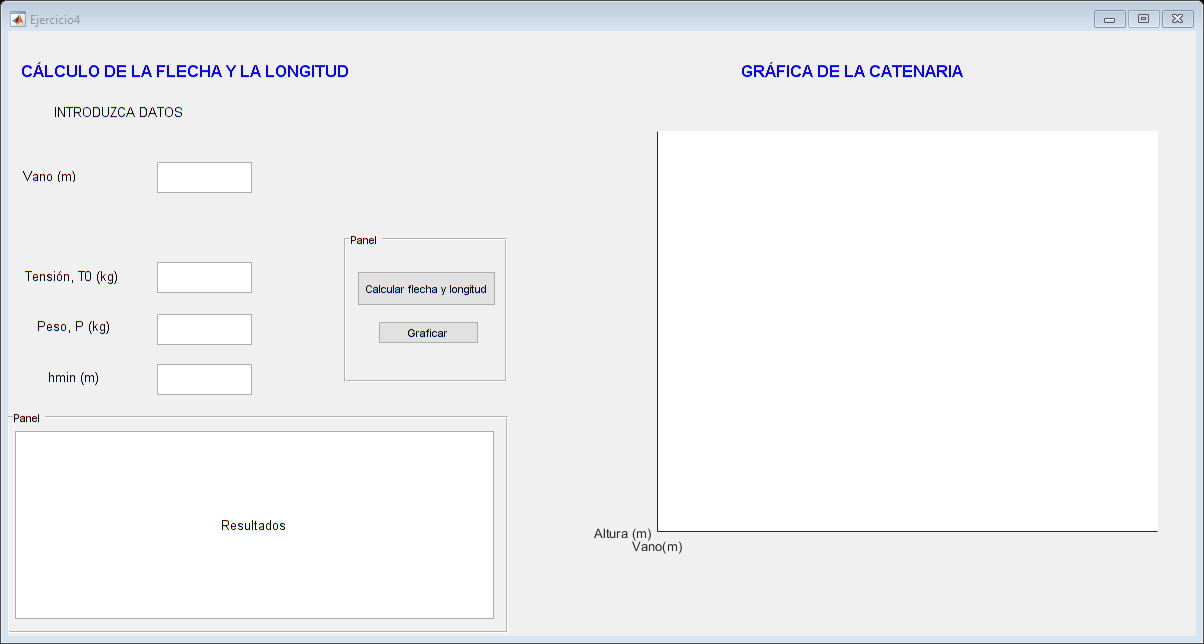
EJERCICIO 4. GUI. Cálculo de la flecha y la longitud así como representación de la catenaria
Ejercicio4
